决策树通常包括:
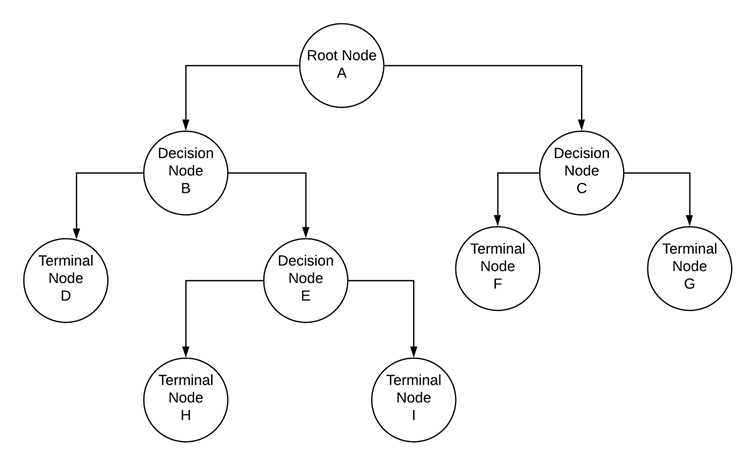
为了理解决策树是如何发展的,我们需要更深入地了解在每一步中如何使用度量使信息增益最大化。
让我们举一个例子,其中我们有包含学生信息的训练数据,如性别、年级、因变量或分类变量,这些变量可以识别学生是否是美食家。我们有以下概述的信息。
让我们根据学生的性别将他们分成两个节点,并重新计算上述指标。
节点A的基尼指数 (GIn)=P²+Q²,其中P和Q是学生成为美食家和非美食家的概率。GIn(节点A)=0.8²+0.2²=0.68
节点A的基尼不纯度(GIp)=1-基尼指数=1–0.68=0.32
节点B或女生的基尼指数(GIn)=P²+Q²,其中P和Q是学生成为美食家和非美食家的概率。GIn(节点B)=0.4²+0.6²=0.52
节点B的基尼不纯度(GIp)=1-基尼指数=1–0.52=0.48
我们观察到的是,当我们将学生按性别(男性和女性)分别划分为A和B节点时,我们分别得到了两个节点的基尼不纯度。现在,为了确定性别是否是将学生分为美食家和非美食家的正确变量,我们需要一个加权基尼不纯度分数,该分数使用以下公式计算。
加权基尼不纯度=(A节点总样本数/数据集中总样本数)基尼不纯度(A节点)+(B节点总样本数/数据集中样本数)基尼不纯度(B节点)
用此公式计算上例的加权基尼不纯度分数,按性别划分学生时加权基尼不纯度分数=(10/20)0.32 + (10/20)0.48 = 0.4
一个分类问题涉及多个自变量。变量可以是名义变量,也可以是连续变量。决策树很适合处理不同数据类型的变量。
决策树算法在决定每个节点的拆分时考虑了所有可能的变量,可以获得最大加权不纯度增益的变量被用作特定节点的决策变量。
在上面的例子中,使用“性别”作为决策变量的加权不纯度增益是0.4,但是,假设使用“年级”作为决策变量,加权不纯度增益0.56,算法将使用“年级”作为创建第一个分割的决策变量。所有后续步骤都遵循类似的方法,直到每个节点都是同构的。
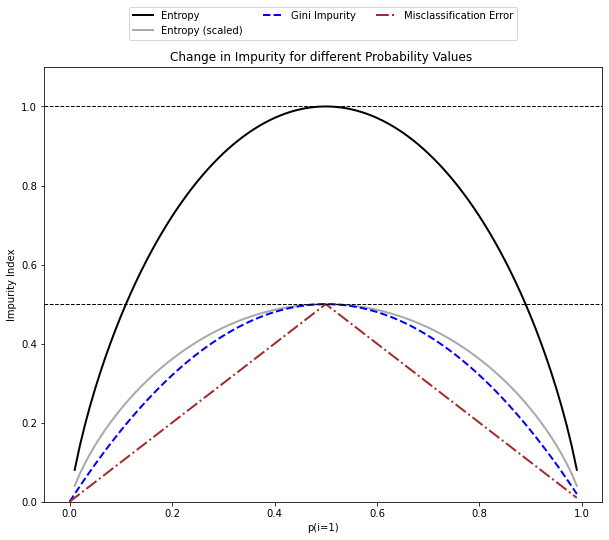
下面概述的代码片段提供了不同不纯度标准的直观比较,以及它们如何随不同的概率值而变化。注意下面的代码改编自Deeper Insights into Machine Learning by S.Raschka, D.Julian, and J.Hearty, 2016。
import matplotlib.pyplot as plt

import numpy as np

#-----计算基尼指数
def gini(p):
    return (p)*(1 - (p)) + (1 - p)*(1 - (1-p))

#-----计算熵
def entropy(p):
    return - p*np.log2(p) - (1 - p)*np.log2((1 - p))

#-----计算分类误差
def classification_error(p):
    return 1 - np.max([p, 1 - p])

#-----创建一个从0到1的概率值Numpy数组,增量为0.01
x = np.arange(0.0, 1.0, 0.01)

#---不同p值的熵
ent = [entropy(p) if p != 0 else None for p in x]

#----获得缩放后的熵
sc_ent = [e*0.5 if e else None for e in ent]

#--分类错误
err = [classification_error(i) for i in x]

#--绘图

fig = plt.figure();
plt.figure(figsize=(10,8));
ax = plt.subplot(111);

for i, lab, ls, c, in zip([ent, sc_ent, gini(x), err], ['Entropy', 'Entropy (scaled)','Gini Impurity',
                                                        'Misclassification Error'],['-', '-', '--', '-.'],
                          ['black', 'darkgray','blue', 'brown', 'cyan']):
    line = ax.plot(x, i, label=lab,
    linestyle=ls, lw=2, color=c)

ax.legend(loc='upper center', bbox_to_anchor=(0.5, 1.15), ncol=3, fancybox=True, shadow=False)
ax.axhline(y=0.5, linewidth=1, color='k', linestyle='--')
ax.axhline(y=1.0, linewidth=1, color='k', linestyle='--')
plt.ylim([0, 1.1])
plt.xlabel('p(i=1)')
plt.ylabel('Impurity Index')
plt.show()
问题陈述旨在建立一个分类模型来预测红酒的质量。
这是一个典型的多类分类问题。注意,所有的机器学习模型都对异常值敏感,因此在构建树之前,应该处理由异常值组成的特征/独立变量。
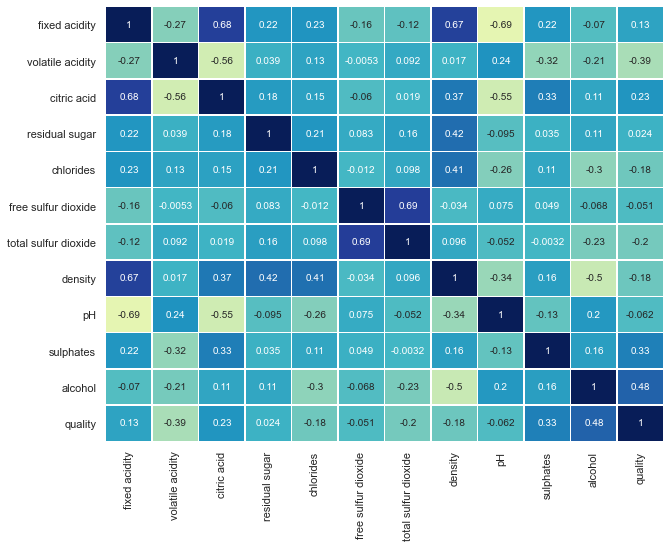
不同特性/独立变量的一个重要方面是它们如何相互作用。皮尔逊相关可以用来确定数据集中两个特征之间的关联程度。然而,对于像决策树这样的基于决策的算法,我们不会丢弃高度相关的变量。
#导入所需的库-
%matplotlib inline

import numpy as np
import pandas as pd

from sklearn.tree import DecisionTreeClassifier

import numpy as np
import pandas as pd
import seaborn as sns

sns.set(color_codes=True)

from matplotlib import pyplot as plt
from sklearn.model_selection import train_test_split #分为训练集和测试集
from sklearn.tree import DecisionTreeClassifier #构建决策树模型

from sklearn import metrics
from sklearn.metrics import accuracy_score,f1_score,recall_score,precision_score, confusion_matrix #模型验证
%matplotlib inline

from IPython.display import display #用于在一个输出中显示多个数据帧

from sklearn.feature_extraction.text import CountVectorizer  #DT不接受字符串作为模型拟合步骤的输入

import missingno as msno_plot #缺失值绘图

wine_df = pd.read_csv('winequality-red.csv',sep=';')
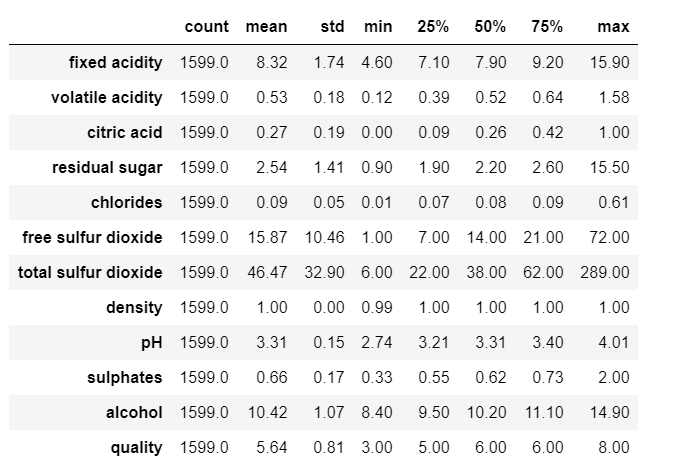
数据的快速描述性统计
wine_df.describe().transpose().round(2)
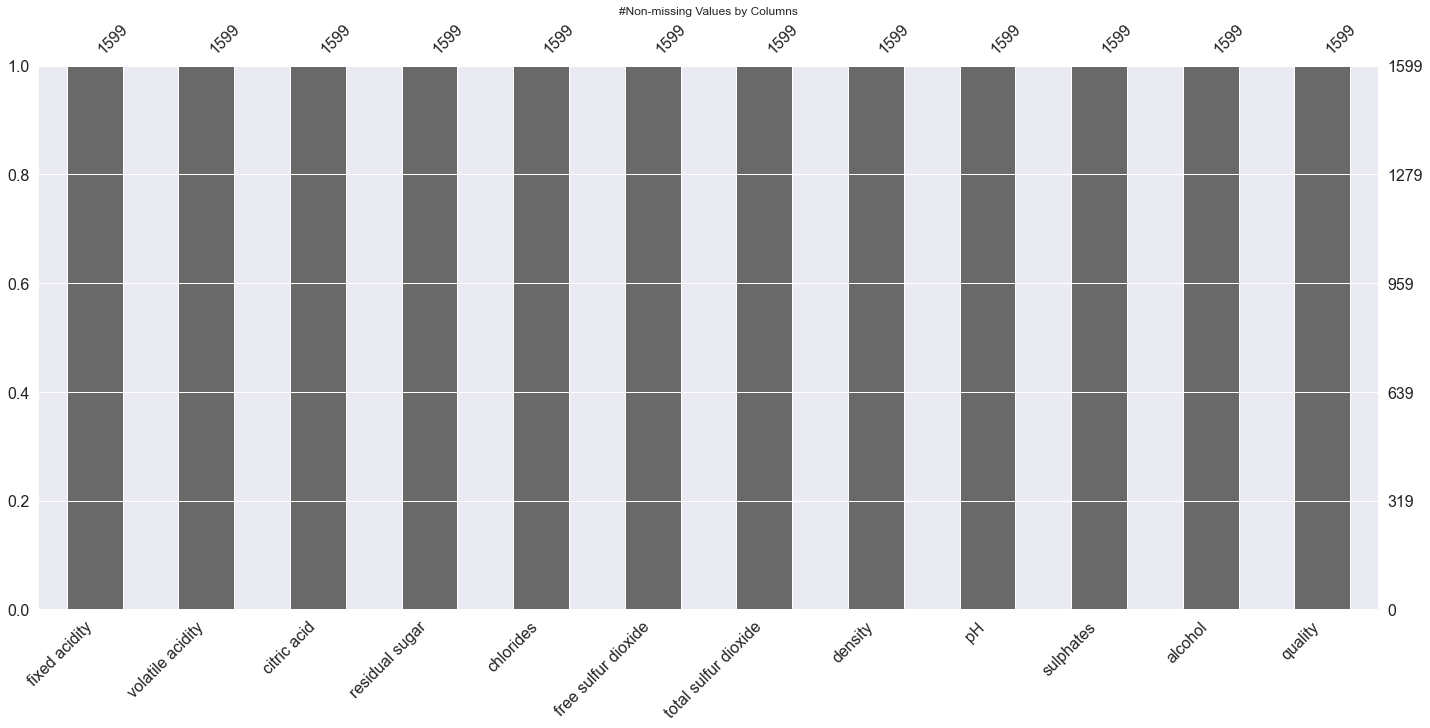
检查缺失值
#非缺失值的条形图
plt.title('#Non-missing Values by Columns')
msno_plot.bar(wine_df);
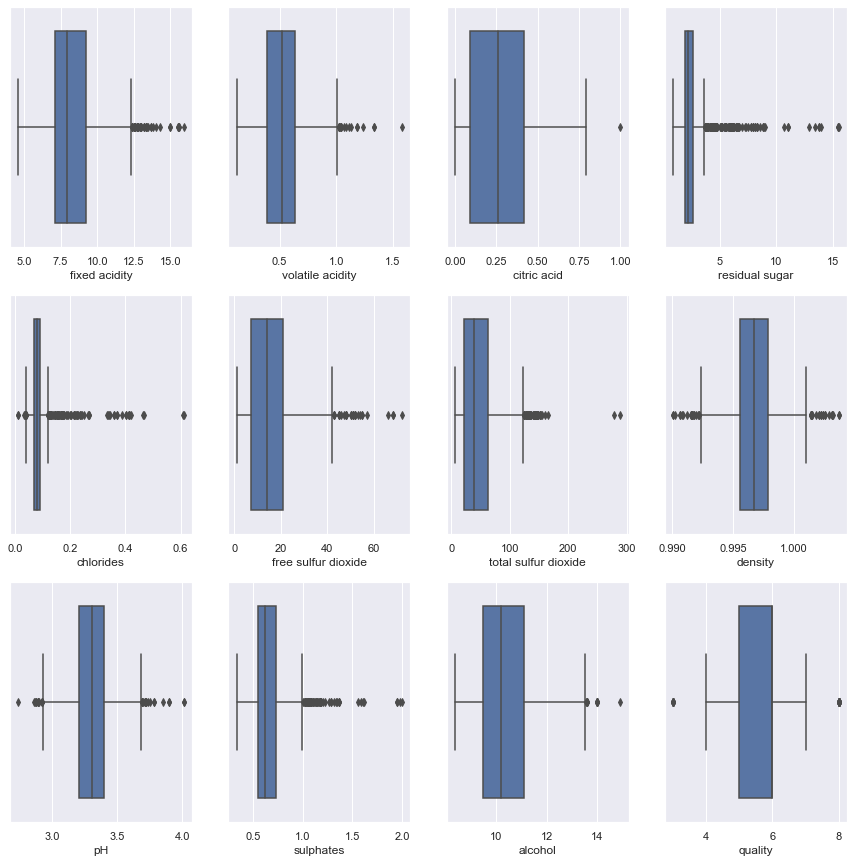
异常值检查和处理
#检查异常值
plt.figure(figsize=(15,15))
pos = 1
for i in wine_df.columns:
    plt.subplot(3, 4, pos)
    sns.boxplot(wine_df[i])
    pos += 1
col_names=['fixed acidity', 'volatile acidity', 'citric acid', 'residual sugar',
       'chlorides', 'free sulfur dioxide', 'total sulfur dioxide', 'density',
       'pH', 'sulphates', 'alcohol']

display(col_names)

for i in col_names:
    q1, q2, q3 = wine_df[i].quantile([0.25,0.5,0.75])
    IQR = q3 - q1
    lower_cap=q1-1.5*IQR
    upper_cap=q3+1.5*IQR
    wine_df[i]=wine_df[i].apply(lambda x: upper_cap if x>(upper_cap) else (lower_cap if x<(lower_cap) else x))
上面的异常值使用Q1–1.5*IQR和Q3+1.5*IQR值进行提取。Q1、Q3和IQR分别代表第一四分位数、第三四分位数和四分位数间的范围。
sns.pairplot(wine_df);
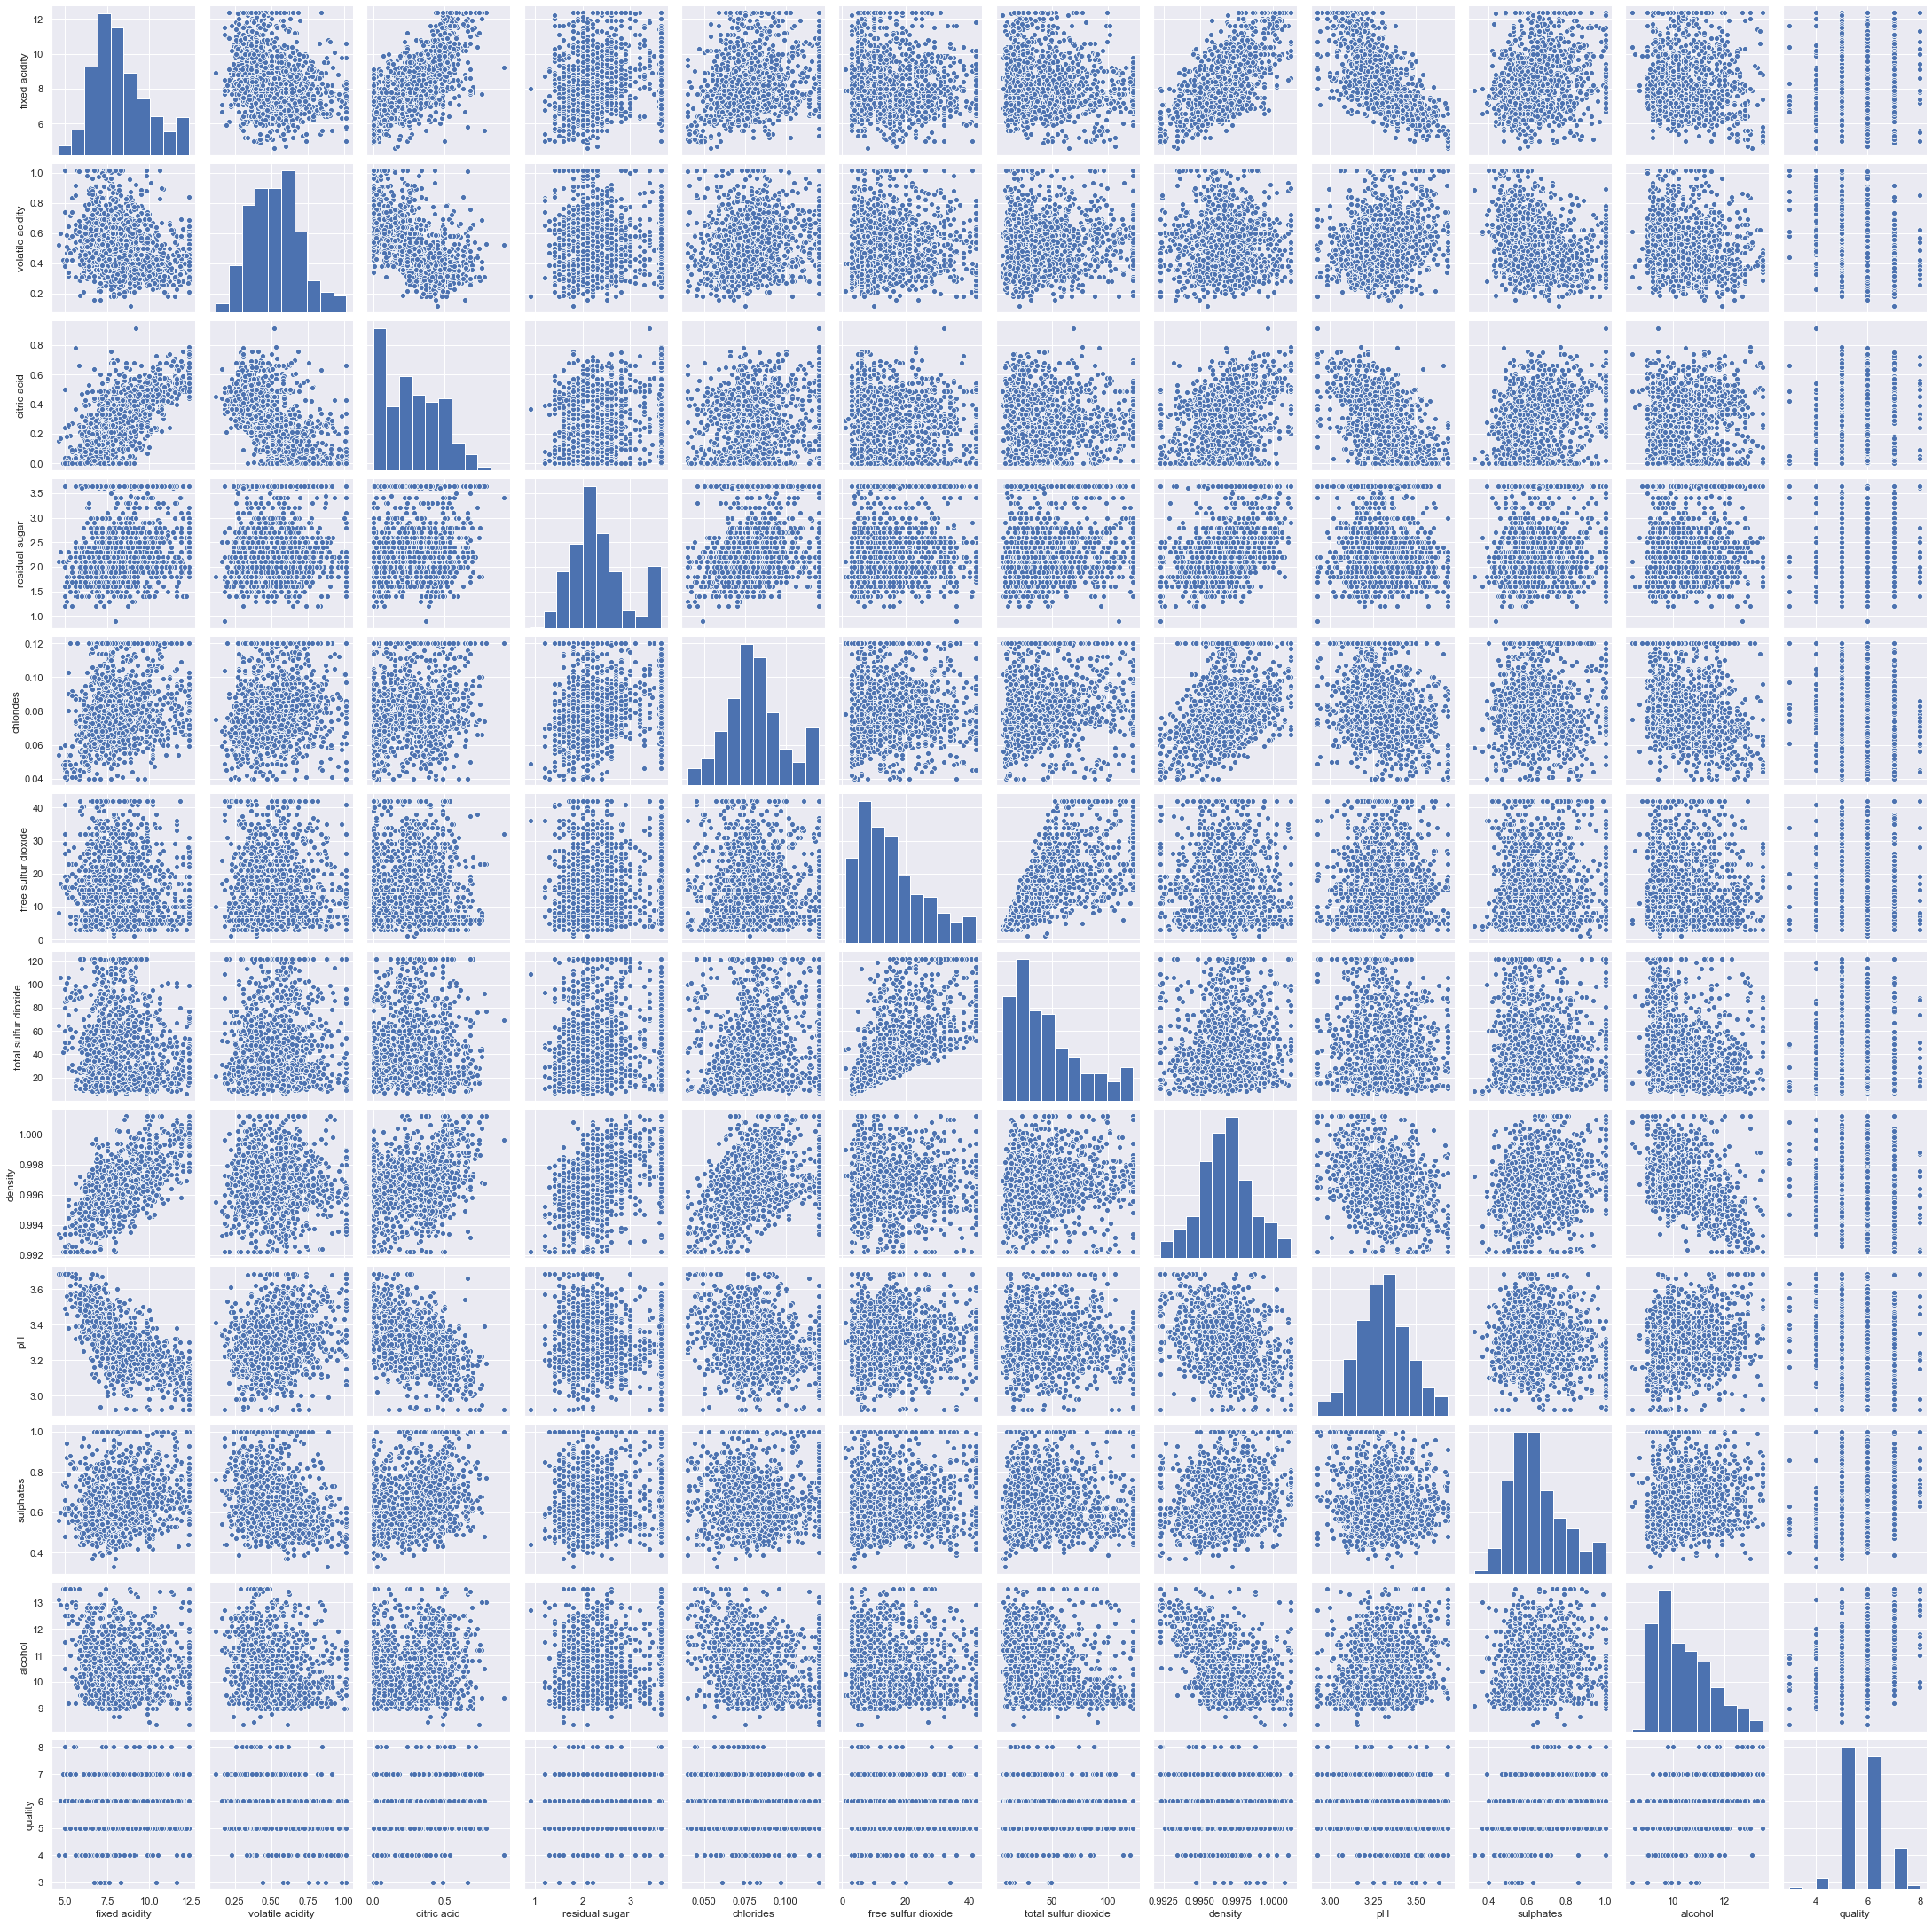
理解不同变量之间的关系。注意。在决策树中,我们不需要删除高度相关的变量,因为节点只使用一个独立变量被划分为子节点,因此,即使两个或多个变量高度相关,产生最高信息增益的变量也将用于分析。
plt.figure(figsize=(10,8))
sns.heatmap(wine_df.corr(),
            annot=True,
            linewidths=.5,
            center=0,
            cbar=False,
            cmap="YlGnBu")
plt.show()
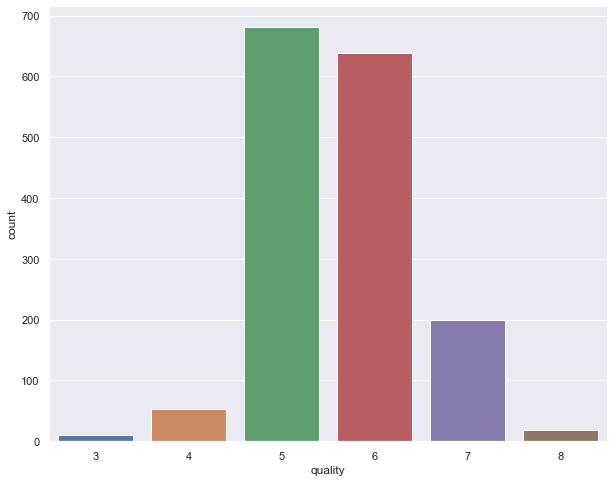
分类问题对类别不平衡很敏感。当一个类值所占比例较大时,就会出现类不平衡。类别平衡是通过将因变量“quality”属性的值组合而产生的。
plt.figure(figsize=(10,8))
sns.countplot(wine_df['quality']);
wine_df['quality'] = wine_df['quality'].replace(8,7)
wine_df['quality'] = wine_df['quality'].replace(3,5)
wine_df['quality'] = wine_df['quality'].replace(4,5)
wine_df['quality'].value_counts(normalize=True)
将数据分为训练集和测试集,以检查模型的准确性,并查找是否存在过拟合或欠拟合。
# 将数据分解为训练集和测试集

from sklearn.model_selection import train_test_split

X_train, X_test, y_train, y_test =train_test_split(wine_df.drop('quality',axis=1), wine_df['quality'], test_size=.3, random_state=22)
X_train.shape,X_test.shape
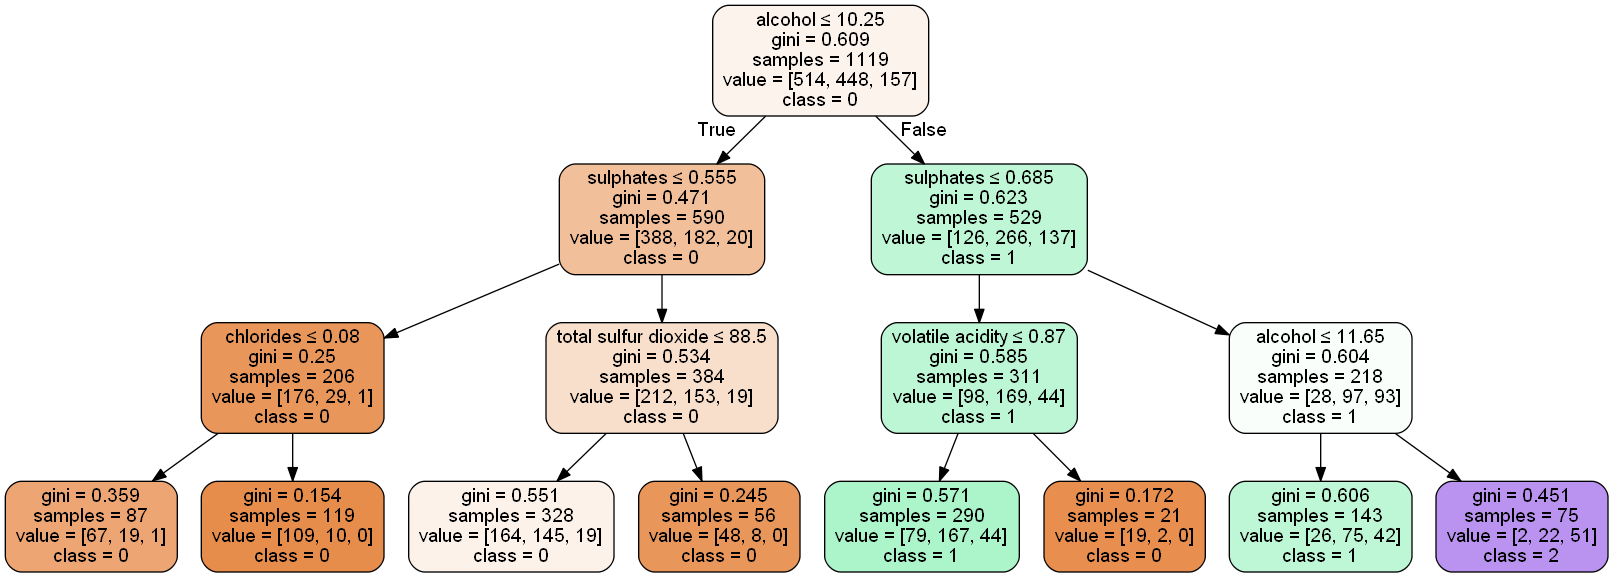
利用基尼准则建立了决策树模型。请注意,为了简单起见,我们将树剪枝到最大深度3。这将有助于我们将树可视化,并将其与我们在初始部分中讨论的概念联系起来。
clf_pruned = DecisionTreeClassifier(criterion = "gini", random_state = 100,
                               max_depth=3, min_samples_leaf=5)
clf_pruned.fit(X_train, y_train)
请注意,可以调整以下参数以改进模型输出(Scikit Learn,2019)。
from sklearn.tree import export_graphviz
from sklearn.externals.six import StringIO
from IPython.display import Image
import pydotplus
import graphviz

xvar = wine_df.drop('quality', axis=1)
feature_cols = xvar.columns

dot_data = StringIO()
export_graphviz(clf_pruned, out_file=dot_data,
                filled=True, rounded=True,
                special_characters=True,feature_names = feature_cols,class_names=['0','1','2'])

from pydot import graph_from_dot_data
(graph, ) = graph_from_dot_data(dot_data.getvalue())
Image(graph.create_png())
preds_pruned = clf_pruned.predict(X_test)
preds_pruned_train = clf_pruned.predict(X_train)
print(accuracy_score(y_test,preds_pruned))
print(accuracy_score(y_train,preds_pruned_train))
模型对训练数据和测试数据的准确度得分分别为0.60和0.62。
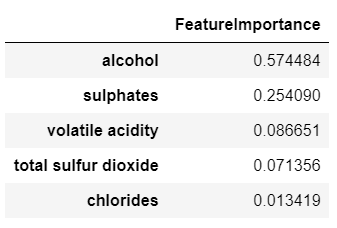
特征重要性是指一类将分数分配给预测模型的输入特征的技术,该技术指示在进行预测时每个特征的相对重要性。
## 计算特征重要性

feat_importance = clf_pruned.tree_.compute_feature_importances(normalize=False)

feat_imp_dict = dict(zip(feature_cols, clf_pruned.feature_importances_))
feat_imp = pd.DataFrame.from_dict(feat_imp_dict, orient='index')
feat_imp.rename(columns = {0:'FeatureImportance'}, inplace = True)
feat_imp.sort_values(by=['FeatureImportance'], ascending=False).head()
DecisionTreeClassifier()提供诸如min_samples_leaf和max_depth等参数,以防止树过度拟合。
可以看成是如下场景,在这个场景中,我们明确定义树的深度和最大叶子数。然而,最大的挑战是如何确定一棵树应该包含的最佳深度和叶子。
在上面的例子中,我们使用max_depth=3,min_samples_leaf=5。这些数字只是用来观察树的行为的示例图。但是,如果在现实中,我们被要求研究这个模型并为模型参数找到一个最佳值,这是一个挑战,但并非不可能(决策树模型可以使用GridSearchCV算法进行微调)。
另一种方法是使用成本复杂性剪枝(CCP)。
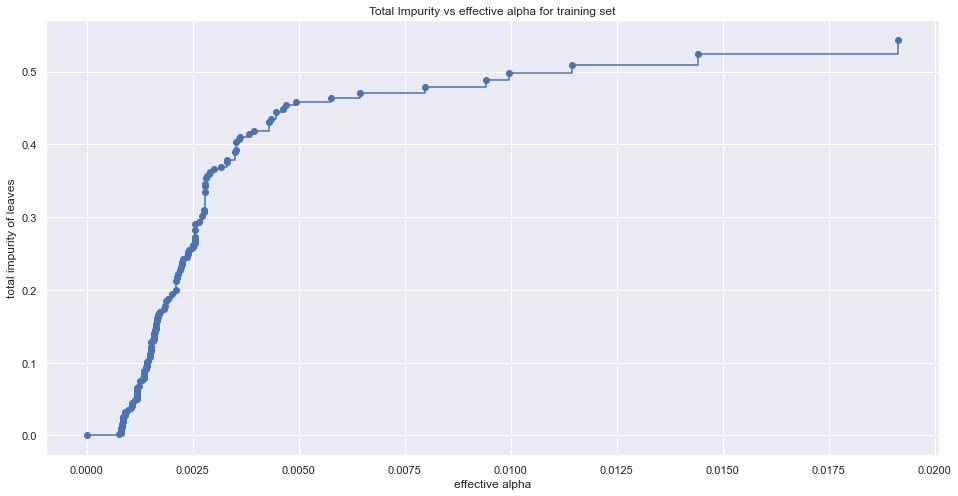
成本复杂性剪枝为控制树的大小提供了另一种选择。在DecisionTreeClassifier中,这种剪枝技术是由代价复杂性参数ccp_alpha来参数化的。ccp_alpha值越大,剪枝的节点数就越多。
简单地说,成本复杂性是一个阈值。只有当模型的整体不纯度改善了一个大于该阈值的值时,该模型才会将一个节点进一步拆分为其子节点,否则将停止。
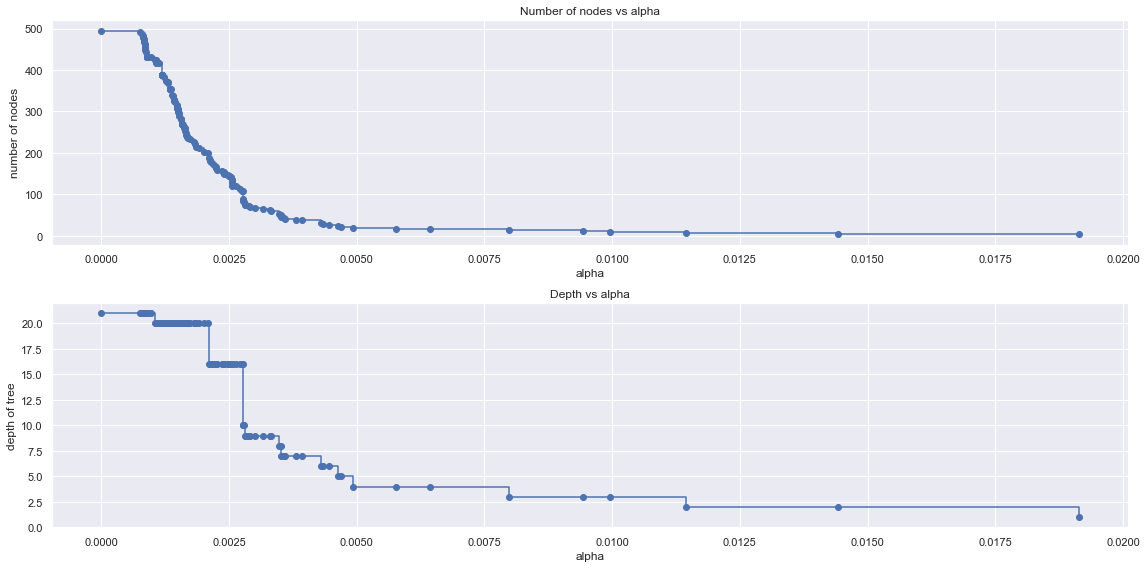
当CCP值较低时,即使不纯度减少不多,该模型也会将一个节点分割成子节点。随着树的深度增加,这一点很明显,也就是说,当我们沿着决策树往下走时,我们会发现分割对模型整体不纯度的变化没有太大贡献。然而,更高的分割保证了类的正确分类,即准确度更高。
当CCP值较低时,会创建更多的节点。节点越高,树的深度也越高。
下面的代码(Scikit Learn)说明了如何对alpha进行调整,以获得更高精度分数的模型。
path = model_gini.cost_complexity_pruning_path(X_train, y_train)
ccp_alphas, impurities = path.ccp_alphas, path.impurities

fig, ax = plt.subplots(figsize=(16,8));
ax.plot(ccp_alphas[:-1], impurities[:-1], marker='o', drawstyle="steps-post");
ax.set_xlabel("effective alpha");
ax.set_ylabel("total impurity of leaves");
ax.set_title("Total Impurity vs effective alpha for training set");
让我们了解随着alpha的变化深度和节点数的变化。
clfs = clfs[:-1]

ccp_alphas = ccp_alphas[:-1]

node_counts = [clf.tree_.node_count for clf in clfs]

depth = [clf.tree_.max_depth for clf in clfs]

fig, ax = plt.subplots(2, 1,figsize=(16,8))

ax[0].plot(ccp_alphas, node_counts, marker='o', drawstyle="steps-post")
ax[0].set_xlabel("alpha")
ax[0].set_ylabel("number of nodes")
ax[0].set_title("Number of nodes vs alpha")
ax[1].plot(ccp_alphas, depth, marker='o', drawstyle="steps-post")
ax[1].set_xlabel("alpha")
ax[1].set_ylabel("depth of tree")
ax[1].set_title("Depth vs alpha")
fig.tight_layout()
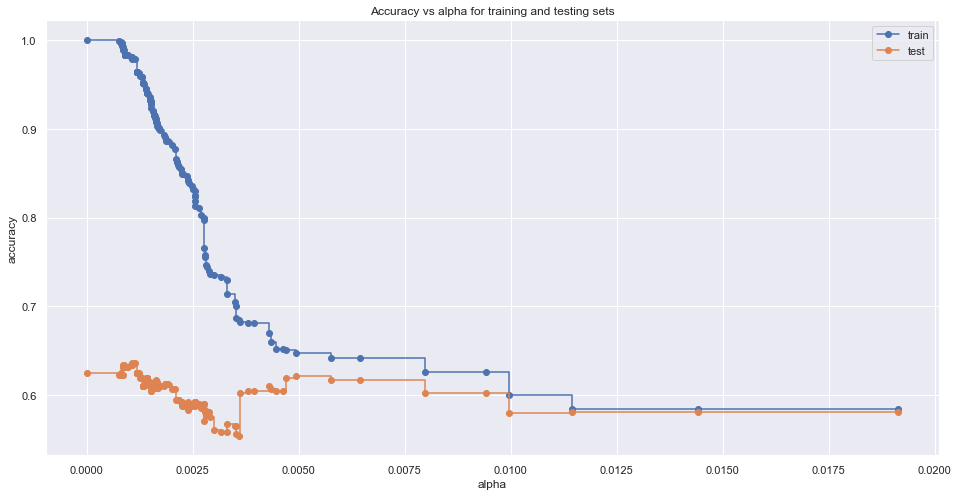
了解α增加时精度的变化。
fig, ax = plt.subplots(figsize=(16,8)); #设置大小
train_scores = [clf.score(X_train, y_train) for clf in clfs]
test_scores = [clf.score(X_test, y_test) for clf in clfs]
ax.set_xlabel("alpha")
ax.set_ylabel("accuracy")
ax.set_title("Accuracy vs alpha for training and testing sets")
ax.plot(ccp_alphas, train_scores, marker='o', label="train",
        drawstyle="steps-post")
ax.plot(ccp_alphas, test_scores, marker='o', label="test",
        drawstyle="steps-post")
ax.legend()
plt.show()
i = np.arange(len(ccp_alphas))
ccp = pd.DataFrame({'Depth': pd.Series(depth,index=i),'Node' : pd.Series(node_counts, index=i),
                    'ccp' : pd.Series(ccp_alphas, index = i),'train_scores' : pd.Series(train_scores, index = i),
                   'test_scores' : pd.Series(test_scores, index = i)})
ccp.tail()
ccp[ccp['test_scores']==ccp['test_scores'].max()]
上面的代码提供了在测试数据中产生最高精度的成本计算剪枝值。